
TL;DR
- The core decision: whether your stage data records what happened or records when somebody got round to clicking.
- When doing nothing is right: when nobody is making decisions from the numbers and nobody has asked.
- What has to be true: stage changes are entered close enough to the event that the timestamps mean something.
- How the options split: by whether a figure is generated by a system or by a person's administrative behaviour.
- Decision rule: if you can't say how a number would move when nothing about hiring changed, don't present it.
- Outcome to expect: fewer figures, honestly caveated, that survive somebody asking how they were produced.
The Quarter Where Hiring Got Faster
Somebody presents a recruiting update. Time to fill is down noticeably on last quarter, and the conclusion in the room is that recent process changes are working.
What actually happened is that a recruiter left in the middle of the quarter, and before leaving they went through the pipeline closing out old records: rejecting candidates who had gone quiet months ago, closing roles that had been filled but never marked as such, and tidying up stages that hadn't been advanced. Several long-running searches disappeared from the open population in a single afternoon.
The number moved because of a data cleanup. Hiring didn't get faster. And nobody in the room could have known, because the figure looks identical either way.
Best tools for Applicant Tracking (ATS)
This is the characteristic problem with recruiting data, and it's different from the usual complaint about definitions. Recruiting numbers are generated as a by-product of people moving candidates through stages while doing other work. That means the data records administrative behaviour at least as much as it records hiring reality, and the two are indistinguishable once they reach a report.
A stage advanced three days late looks exactly like a stage that genuinely took three extra days. A candidate who was rejected but never marked as such stays in the pipeline forever, inflating everything. A role reopened rather than created fresh carries its old dates with it. Each of these is an ordinary, blameless thing somebody did while busy, and each moves a number in a direction nobody tracks.
So the reframe worth holding is that your reporting can only be as honest as the stage discipline underneath it. That's not an argument against measuring. It's an argument for knowing which of your figures survive how people actually use the system, and presenting only those without heavy caveats.
When You Genuinely Do Not Need to Act Yet
Your current setup is genuinely fine. Nobody is making decisions from recruiting numbers, nobody has asked for them, and the team knows how its searches are going by talking about them. At low volume that's genuinely better information than any report.
Friction is starting to show. Somebody asked a question you couldn't answer, or two people produced different figures, or a number was presented and somebody queried it. These are early and useful, because they tell you what's actually wanted before you build anything.
It has become a real cost. Decisions are being made from figures nobody can defend, or the team spends real time assembling numbers each period, or a presented figure turned out to be wrong in a way that was embarrassing. Now it's worth fixing the underlying data rather than the reporting.
The edge case that forces it. You have to report externally, to a board or a governing body, on hiring activity. Or you're required to report on the composition of your applicant pool, which is a different exercise with obligations attached that differ by jurisdiction and by sector. Establish what applies where you hire with local advice, because an externally defined requirement isn't yours to design around.
Five Questions This Reader Asks at 11pm
Why don't our recruiting numbers make sense? Because they're a by-product of administrative behaviour rather than a record of events. Stage timestamps record when somebody clicked, candidates who were rejected informally never get closed, and roles get reopened rather than created. None of that is anybody's fault and all of it moves the figures.
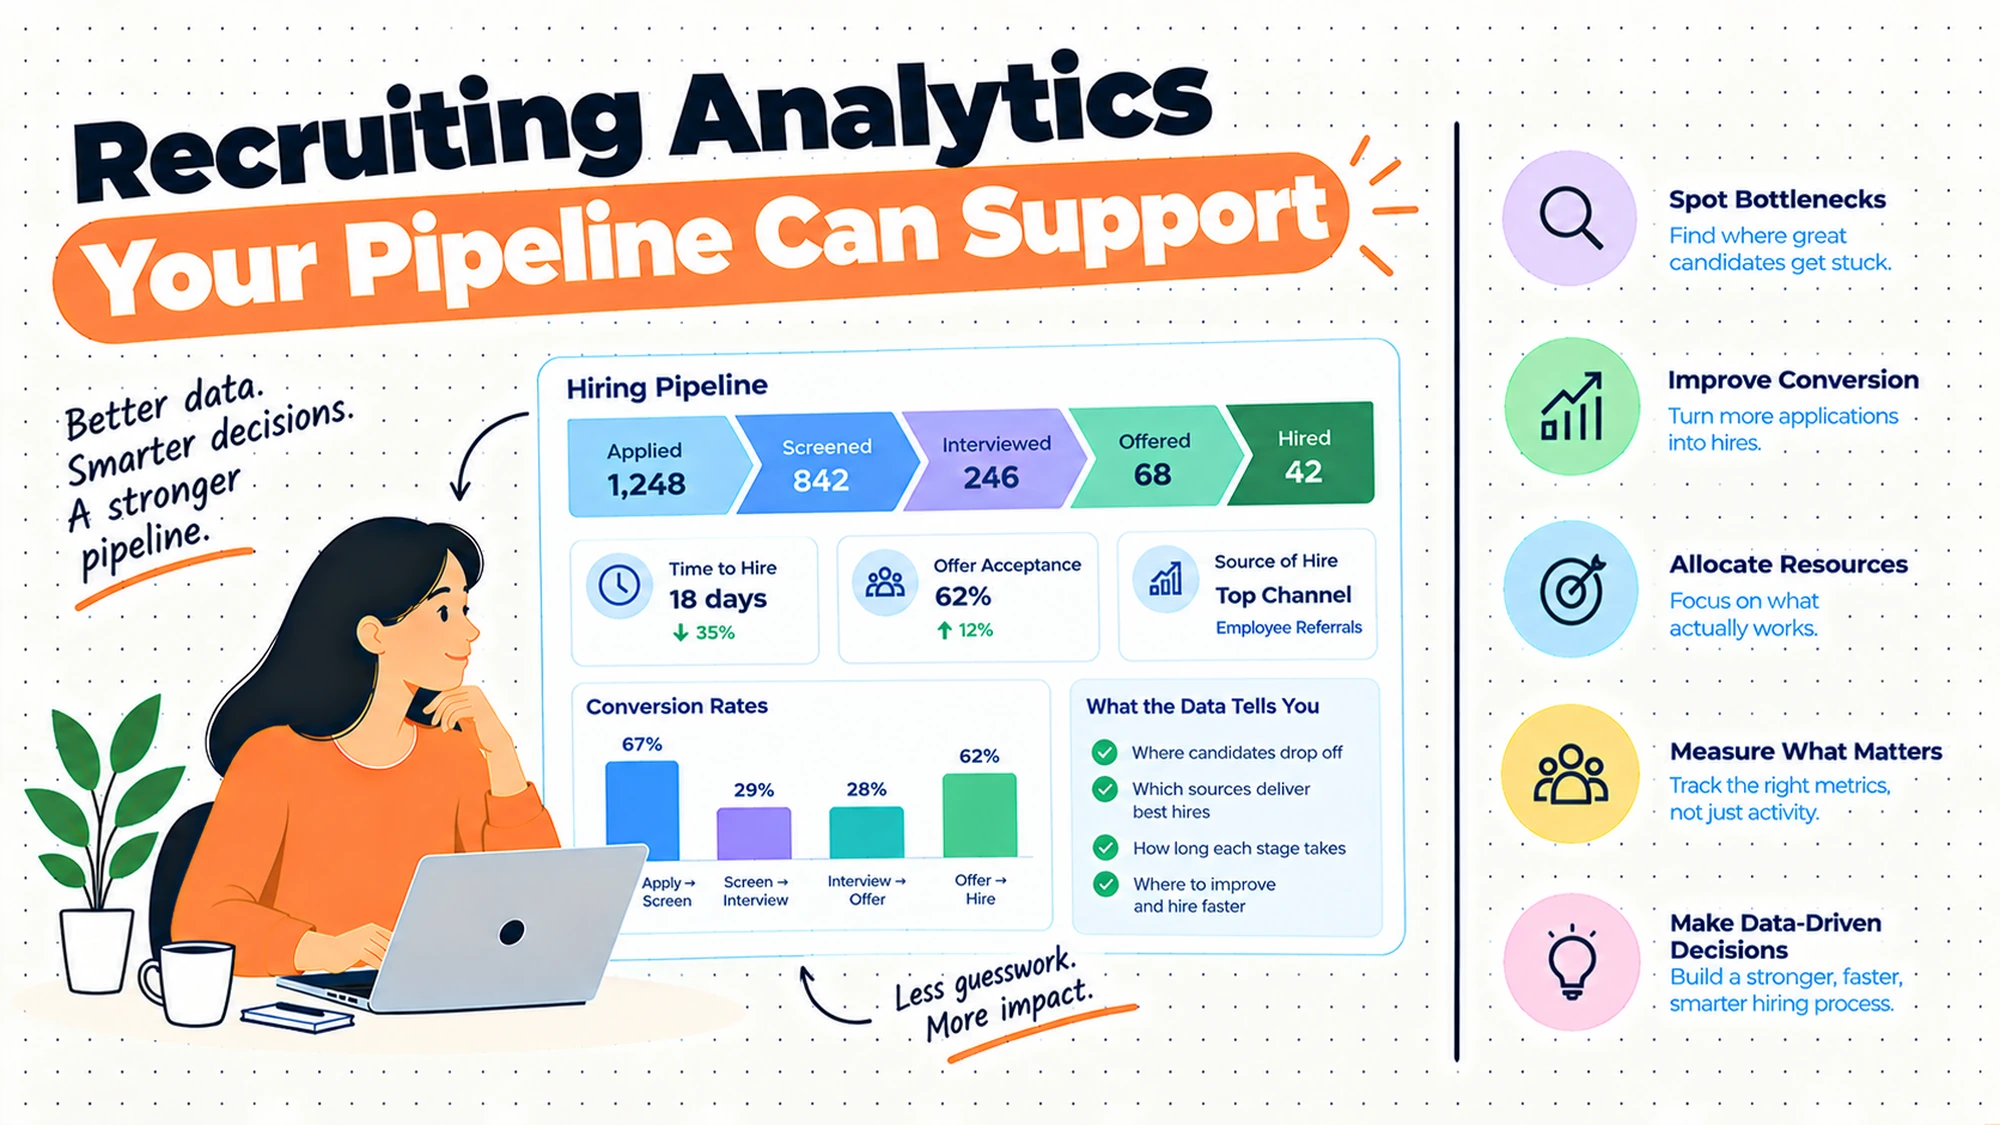
What's actually worth measuring? Fewer things than are available, and the honest first step is to ask what decision a number would change. Most recruiting reporting exists because the system produces it rather than because anybody asked, and a figure nobody would act on differently is a figure worth dropping.
Can we trust source attribution? Partially, and less than people assume. The source recorded is where somebody happened to enter your process, which frequently isn't what made them apply. A person who heard about you from a friend, looked you up, and then applied through a job board is recorded as coming from the board, and the friend is invisible.
Why does our conversion rate keep moving? Usually because the denominator is unstable rather than because anything changed. Candidates who were never closed out stay in the pipeline, roles with different stage structures get averaged together, and a single high-volume search can swamp everything else in the period.
How do we make the data better? Stage discipline, which means fewer stages entered closer to when things actually happen. That's a behaviour change rather than a configuration one, and it's considerably more achievable with five stages than with twelve.
How the Numbers Get Distorted
Each of these is ordinary behaviour with a predictable effect, and knowing them tells you which figures to distrust.
| The behaviour | The figure it moves | The direction it moves it |
|---|---|---|
| Stage advanced days after the event | Time in stage, time to hire | Upward, inconsistently |
| Candidates rejected informally, never closed | Pipeline volume, conversion | Volume up, conversion down |
| A pipeline cleanup before somebody leaves | Time to fill, open roles | Sharply down, all at once |
| A role reopened rather than created | Time to fill for that role | Upward, sometimes enormously |
| Rejections recorded in a batch | Time in stage | Upward for everybody in the batch |
| One high-volume search in the period | Every average in the report | Toward that search's characteristics |
| A stage nobody uses in practice | Conversion between adjacent stages | Toward implausible extremes |
| Candidates entered late, after a conversation | Source attribution, early-stage volume | Understates both |
The third row is the one from the opening scene and it's worth watching for specifically. A sudden improvement in time-based figures that coincides with somebody leaving, a system change or an audit is usually a data event rather than a hiring event. The test is whether anything about how you hire changed in the same period.
The sixth row is the reason period-on-period comparison is so unreliable in recruiting. Most organisations run a small number of searches in any period, and one high-volume role will dominate every average. That isn't noise you can smooth out; it's a structural property of small numbers, and it means movement between periods frequently reflects which roles happened to be open rather than any change in performance.
The eighth row catches the searches that matter most. Senior and specialised hiring frequently begins with conversations, and the candidate only gets entered into the system once things are serious. Everything before that is invisible, which means your data systematically understates effort on exactly the roles that took the most.
Five Diagnostic Questions You Can Self-Assess Against
How soon after an interview does the stage change? Ask somebody, or check a few records against calendar invitations. If the gap is routinely days, your timing data measures administrative latency rather than process speed, and every duration figure you produce is inflated by an unknown amount.
How many candidates are sitting in a stage with no recent activity? Count them. Most pipelines hold a substantial population of people who are effectively finished and never closed, and they inflate volume while deflating every conversion figure.
Do all your roles use the same stages? If not, any figure averaged across roles is combining things that aren't comparable. That's acceptable if you know it and misleading if you don't.
Could you explain how a number was produced? Take one from your last report and trace it. If the answer requires opening the configuration to find out what was included, nobody presenting it can defend it when asked.
What would you do differently if this number halved? Ask it of each figure you report. Anything with no answer is being reported because it's available, and dropping it makes room for the ones that would change something.
Six Things Teams Try to Measure, Reviewed
How long a hire takes
Elapsed time from some starting point to some ending point. It earns its place because it's the question everybody asks and because a genuinely slow process is a real problem worth knowing about.
Where it falls short is that both ends are ambiguous and the middle is administrative. The start could be when the role was approved, when it was advertised, or when the first candidate applied. The end could be offer acceptance or the actual start date. Between them, every stage timestamp reflects when somebody clicked. The figure is also dominated by whichever search happened to be hardest.
If you use it, define both ends explicitly, report it per role rather than averaged, and treat movement of less than a large margin as noise.
There is a version of this figure that is considerably more useful and almost nobody produces, which is elapsed time split by who was waiting. Days where a candidate was waiting on you and days where you were waiting on a candidate are completely different problems, and the total conceals which one you have. Splitting it requires no new data, only a convention about which side each gap belongs to, and it usually relocates the constraint from sourcing to internal review.
Where candidates come from
Source attribution: which channel produced which applicants. It earns its place because it informs where effort goes, and because at high volume the pattern is genuinely informative.
Where it falls short is that the recorded source is the last touch rather than the cause. Somebody who heard about you from a friend, read about you, and then applied via a board is attributed to the board. Referrals in particular are systematically undercounted, because a referred person frequently applies through the normal route.
Treat it as a record of entry points rather than of influence. Where a source matters, ask candidates directly at some point in the process, which is imperfect and closer to the truth.
Ask it at the right moment too. A question about how somebody heard of you, placed on the application form, gets answered carelessly by people who are trying to finish an application. The same question asked in a first conversation gets a real answer, frequently with a story attached, and the story is usually the part worth knowing.
Where candidates are lost
Drop-off between stages: how many progress, how many don't. It earns its place because a large loss at a specific point is a real signal, and because it's one of the few recruiting figures that points at something actionable.
Where it falls short is that it can't distinguish rejection from withdrawal, which are opposite findings. A stage where half the candidates leave looks the same whether you rejected them or they lost interest, and the responses are completely different. Most systems record an outcome without capturing which side initiated it.
Capture who ended it, at every exit. It's one extra field and it converts a useless figure into a diagnostic.
The distinction also matters for how you read a stage everybody is worried about. Heavy loss at a late stage is alarming if candidates are withdrawing and entirely healthy if you are rejecting, because a process that eliminates people late is doing its job even though the shape of the funnel looks wrong. Without the field, those two produce the same chart and invite the same panic.
How much of the pipeline converts
Ratios from application through to hire. It earns its place as a planning aid: if you know roughly how many applications a hire takes, you can estimate what a search needs.
Where it falls short is instability. The denominator includes everybody who was never closed out, the numerator is a small number, and a single search can dominate. Conversion figures for recruiting move considerably between periods for reasons unrelated to anything anybody did.
Use it for rough planning within a role type, over a long enough window to mean something. Don't use it to compare periods or to assess performance.
Be especially wary of using it across role types, which is the most common misuse. Conversion for a role with a large applicant pool and heavy filtering looks nothing like conversion for a senior search conducted mostly through conversations, and averaging them produces a number that describes neither. If you report it at all, report it separately by the kind of hiring involved.
How busy the recruiting team is
Workload: open roles per person, candidates in process, activity volume. It earns its place because it's one of the few arguments a recruiting team has in a resourcing conversation, and assertion loses to a budget while evidence sometimes doesn't.
Where it falls short is that open roles are a poor proxy for effort. One senior search can consume more attention than several straightforward ones, and a role that's open but stalled waiting on a manager takes almost none. Counting roles treats all of them as equivalent, which they aren't.
Weight it if you can, even crudely, and pair it with what's ageing rather than only what's open.
Ageing is the more persuasive of the two in a resourcing conversation, because it describes a consequence rather than a workload. Saying the team has a certain number of open roles invites an argument about how many is reasonable. Showing that several searches have been open past the point anybody intended, with the reasons, moves the conversation onto what is actually happening rather than onto how busy people feel.
Whether the process treats people consistently
Whether candidates experience comparable processes and whether outcomes differ across groups. It earns its place because consistency is a genuine property worth knowing about, and because in some places reporting on it isn't optional.
Where it falls short is that this is the area where data quality problems become consequential rather than merely annoying. Parsed fields, inconsistent stage usage and incomplete records all distort the picture, and a distorted picture here is considerably worse than no picture.
What you're required to collect, how it must be handled and kept separate, and what you may do with it differ by jurisdiction and by sector, and several requirements have been changing. This is the one area on this list where local advice comes first and the reporting design follows from it.
One practical point that holds regardless of jurisdiction: information collected for this purpose should be gathered directly from candidates rather than inferred from documents or names. Inference is both less accurate and considerably harder to defend, and it produces a picture that looks authoritative while resting on guesses. What you may ask and how it must be stored is the part that needs local advice.
The Decision Table
| Situation | Scale | Setup | Primary Pain | Recommended Starting Point |
|---|---|---|---|---|
| Nobody uses the numbers | Under twenty hires a year | Any | None | Talk about searches instead |
| A figure was queried and could not be defended | Any | Any | Nobody can trace it | Trace one number, end to end |
| Time to hire moved sharply | Any | Any | Probably a data event | Check what changed administratively |
| Candidates sitting with no activity | Any | Any | Inflated volume, deflated conversion | Close them out, then measure |
| Different stages per role | Any | Flexible configuration | Averages combining incomparable things | Report per role type |
| Drop-off at a stage, cause unknown | Any | Any | Rejection and withdrawal conflated | Capture who ended it |
| Recruiting team arguing for resource | Any | Any | Assertion without evidence | Count ageing, not just open roles |
| Numbers reported nobody acts on | Any | Any | Reporting because it exists | Drop anything with no decision attached |
| Reporting on pool composition | Any | Regulated or required | Obligations, not design | Take local advice first |
The third row deserves a standing habit rather than a one-off check. Any sharp movement in a recruiting figure should prompt the question of what changed administratively before anybody concludes something about hiring. Data cleanups, system changes, a departure, a new stage configuration: all of them move numbers without anything about hiring changing.
The eighth row is the most useful pruning exercise available here. Go through your last report and ask, for each figure, what you'd do differently if it moved substantially. Most recruiting reports lose half their content to that question, and what remains is both more defensible and more likely to be read.
Do it with whoever receives the report rather than alone, because the answer frequently surprises both parties. Figures that were added years ago because somebody senior asked once are still being produced long after that person stopped looking at them, and the only way to find out is to ask.
What the Pipeline Cannot Tell You
Some questions look like data questions and aren't, and trying to answer them from pipeline data produces figures that mislead.
Whether a hire was any good. The pipeline records that somebody was hired. Everything about whether that was the right decision lives elsewhere and arrives months later. Any attempt to evaluate sourcing or assessment quality from pipeline data alone is measuring the process rather than its outcome.
Why candidates withdrew. The recorded reason is what somebody offered politely, which is usually another offer or timing. The actual reason is frequently something about your process that they had no incentive to mention. This is why the data systematically conceals your own contribution to losses.
Whether the process is any good for candidates. Duration data tells you how long things took, not what the experience was. A fast process with no communication rates poorly with candidates and looks excellent in your reporting.
Whether an interviewer is any good. Tempting, because the system records who interviewed whom and what the outcome was. It can't account for who they saw, what stage they worked at, or whether they were assessing the hard cases. Conclusions about individuals from pipeline data are usually unsafe.
The one exception worth allowing is participation rather than judgement: whether somebody submits feedback at all, and how long they take, is recorded reliably and is genuinely about them.
Why a role is hard to fill. The pipeline shows that few people applied or that candidates dropped out. It can't tell you whether the role is poorly described, badly paid, unattractive, or genuinely scarce in the market, and those need completely different responses.
What your market looks like. Your pipeline contains people who applied to you, which is a self-selected sample of people who'd heard of you and were interested. It says nothing about who's out there.
That limitation matters most when somebody uses pipeline data to argue that a skill is scarce. Scarce in your applicant pool and scarce in the market are different claims, and the first is frequently a statement about your reach or your description rather than about availability. Establishing the second needs information from outside your own process.
The common thread is that pipeline data describes your process well and describes outcomes and causes badly. That's a reasonable thing for it to be. The trouble starts when a report is used to answer questions in the second category, which happens because the report exists and the alternative requires talking to people.
The alternative is worth naming rather than implying, because it sounds soft and it is the only thing that works for these questions. Ten minutes with a hiring manager about why a search is difficult produces a better answer than any figure, and asking two recent candidates what the process was like produces a better answer than any duration. Neither scales, and neither needs to, because the questions they answer arise a few times a quarter rather than continuously.
Where Recruiting Analytics Goes Wrong
| The failure | How it shows up | What would have to change |
|---|---|---|
| Timestamps treated as event times | Durations inflated by admin latency | Fewer stages, entered sooner |
| Unclosed candidates left in the pipeline | Volume up, conversion down, both wrong | Close them out routinely |
| Averages across incomparable roles | A figure describing nothing in particular | Report per role type |
| Rejection and withdrawal conflated | Drop-off with no diagnosis available | Capture who ended it |
| A data event read as a hiring change | Congratulations for a cleanup | Check what changed administratively |
| Reporting everything the system produces | Nobody reads it, nothing is acted on | Drop figures with no decision attached |
The first row is the root cause of most of the others, and the fix is counterintuitive: reduce the number of stages. Stage discipline is a behaviour, behaviours fail under load, and a five-stage pipeline gets maintained accurately far more often than a twelve-stage one. You lose granularity you were never able to trust and gain timing data that means something.
The resistance to this is usually that granularity feels safer, on the theory that you can always aggregate up but never break a stage apart afterwards. That would be true if the detailed data were accurate, and it is precisely the detail that is not: a twelve-stage pipeline maintained loosely produces eleven boundaries whose timestamps mean nothing, which cannot be aggregated into anything trustworthy.
The fourth row is a single field and it changes what drop-off data is worth. Knowing that candidates left a stage tells you nothing actionable. Knowing whether you rejected them or they withdrew tells you whether to look at your assessment or at your process, which are entirely different investigations.
What to Put in Writing
| Artefact | Who owns it | When it is written | What it prevents |
|---|---|---|---|
| Which figures are reported, and what decision each informs | Whoever runs hiring | Before the next report | Reporting because the system produces it |
| Where each figure starts and ends | Whoever runs hiring | Before reporting it | Numbers nobody can trace |
| That every exit records who ended it | Whoever runs hiring | Before the next search | Drop-off data with no diagnosis |
| The rule for closing inactive candidates | The recruiting team | Now | A pipeline inflated by the finished |
| The caveat that travels with each figure | Whoever presents it | With the figure itself | Numbers treated as more solid than they are |
| What must be reported, where you hire | HR, with local advice | Before designing anything | Requirements assumed rather than established |
The fifth row is worth more than it sounds. Recruiting figures are fragile, and the honest response is to say so when presenting them rather than to stop presenting them. A number offered with a short caveat about what would move it is both more useful and more credible than the same number presented flat, and it protects everybody when somebody eventually asks.
Questions to Ask Before You Commit
On the decision. What would you do differently if this halved? A bad answer is that it's good to know.
On the timestamp. When does the stage get advanced? A bad answer is when there's time.
On the pipeline. How many are sitting with no activity? A bad answer is that nobody has counted.
On exits. Do you know who ended it? A bad answer is that they were rejected.
On movement. What changed administratively? A bad answer is that hiring improved.
On obligations. What must we report, where we hire? A bad answer is whatever the system does.
On waiting. Who was waiting during that gap? A bad answer is that it is all elapsed time.
What Getting This Wrong Costs
The first cost is effort directed at the wrong part of the process. A report showing a long duration at one stage sends people to fix that stage, and if the duration reflects when somebody records outcomes rather than how long the stage takes, the effort produces nothing. Meanwhile the actual constraint, which is frequently a manager who takes a week to give feedback, stays invisible because it lives in a gap the data attributes elsewhere.
The second cost is the credibility spent when a figure is queried. Recruiting numbers are eventually questioned by somebody who wants to understand them, and if nobody can explain how one was produced or what was included, the whole report becomes suspect. That doesn't reverse, and it takes with it the figures that were sound.
The third cost is the decision made on a data artefact. The opening scene is the mild version, where a cleanup is mistaken for an improvement. The expensive version is a resourcing or process decision made on a number that moved for administrative reasons, and nobody can subsequently work out why the expected benefit didn't arrive.
There is a fourth cost that falls on the recruiting team and is rarely acknowledged. Being measured on figures that move for reasons outside anybody's control is demoralising in a specific way: good quarters and bad quarters stop corresponding to good and bad work, and the rational response is to manage the number rather than the process. Any figure that can be improved by tidying the pipeline will eventually be improved that way.
So before your next report, do two things. Take each figure and ask what decision it would change, dropping the ones with no answer. And trace one number end to end, from the definition through to what was included, to find out whether you could defend it. Most reports lose half their content to the first exercise and gain considerably from it.
When You Are Ready to Go Further
None of this needs a reporting tool. It needs fewer stages so the discipline holds, a routine for closing out candidates who are finished, and one extra field recording who ended each exit.
Then prune the report. Anything nobody would act on differently comes out, and what remains gets a short caveat about what would move it for non-hiring reasons. A shorter report with honest qualifications is read and trusted; a comprehensive one that nobody can defend is neither.
After that, the most useful addition isn't a metric. It's the habit of checking what changed administratively whenever a figure moves sharply, before anybody concludes something about hiring. That single question would have caught the opening scene, and it costs nothing.
Make it somebody's explicit job to ask it, ideally whoever presents the numbers, because it is the kind of question that occurs to everybody afterwards and to nobody in the room.
HROpsLab publishes independent comparison work across HR tooling, applicant tracking and payroll. We sell nothing, we take no vendor money, and we publish no paid placements. If the next step is looking at what your current tooling actually supports here, our comparison work is one place to start.
Frequently Asked Questions
What is recruiting analytics?
Reporting built on the data your hiring process generates: how long things take, where candidates come from, where they're lost, how much of a pipeline converts. The property that shapes everything about it is that this data is a by-product of people moving candidates through stages while doing other work, which means it records administrative behaviour at least as much as hiring reality. A stage advanced three days late is indistinguishable from a stage that genuinely took three extra days once the figure reaches a report.
Why are recruiting numbers so unreliable?
Several ordinary behaviours each move figures in predictable directions. Stage timestamps record when somebody clicked rather than when something happened. Candidates rejected informally but never closed out stay in the pipeline, inflating volume and depressing conversion. Roles reopened rather than created carry old dates. And because most organisations run few searches in any period, one high-volume role dominates every average, so period-on-period movement frequently reflects which roles happened to be open rather than any change.
Can you trust source attribution in recruiting?
Partially, and less than most people assume, because the recorded source is the last touch rather than the cause. Somebody who heard about you from a friend, looked you up and then applied through a job board is attributed to the board, and the friend is invisible. Referrals are systematically undercounted for exactly this reason. Treat it as a record of entry points rather than influence, and where a channel decision matters, ask candidates directly at some stage rather than relying on the field.
How do you improve recruiting data quality?
Reduce the number of stages, which is counterintuitive and effective. Stage discipline is a behaviour performed by busy people, and behaviours fail under load, so a five-stage pipeline gets maintained accurately far more often than a twelve-stage one. You lose granularity you could never trust anyway and gain timing data that means something. Then add a routine for closing out candidates who are effectively finished, since unclosed records distort both volume and conversion simultaneously.
What should you measure in recruiting?
Start from the other end: ask what decision each figure would change. Most recruiting reports contain numbers that exist because the system produces them rather than because anybody asked, and going through a report asking what you'd do differently if each figure halved typically removes half of it. What remains is more defensible and more likely to be read. The specific choice of metrics matters less than whether anybody would act on them and whether you can explain how they were produced.
Why did our time to hire suddenly improve?
Check what changed administratively before concluding anything about hiring. Sharp movements in time-based recruiting figures are frequently data events rather than process improvements: somebody cleaned up the pipeline, a departing colleague closed out old records, a stage configuration changed, or several long-running searches were finally marked as filled. The test is whether anything about how you actually hire changed in the same period, and the honest answer is often that it didn't.
What can recruiting data not tell you?
Whether a hire was any good, which arrives months later and lives elsewhere. Why candidates withdrew, since the recorded reason is what somebody offered politely rather than what actually happened. Whether the experience was good for candidates, because duration isn't experience. Whether an individual interviewer is any good, since the data can't account for who they saw or at what stage. And what your market looks like, because your pipeline contains a self-selected sample of people who'd heard of you.
How should you report on the composition of your applicant pool?
Carefully, and starting from what's required of you rather than from what the system produces. This is the area where data quality problems become consequential rather than annoying, since parsed fields and inconsistent records distort a picture that people will act on. What you must collect, how it has to be handled and kept separate from decision-makers, and what you may do with it differ by jurisdiction and by sector, and several requirements have changed recently. Take local advice first and design the reporting from that.
The data records when somebody clicked. Know which of your figures survive that.
Then report fewer of them, with the caveat attached.