

TL;DR
- The core decision: which hiring numbers you report, given that the ones easiest to produce are the ones least connected to any decision.
- When doing nothing is right: when nobody asks for hiring numbers, and the roles you open close without anyone worrying about them.
- What has to be true: every metric on the report is attached to a named decision and a named person who makes it, or it comes off the report.
- How the options split: by what they measure, speed, origin, conversion, outcome, or the cost your own team is paying.
- Decision rule: if a plausible movement in the number wouldn't change what somebody does next week, it isn't a metric, it's trivia.
- Outcome to expect: a shorter report, harder questions, and an executive conversation about hiring that isn't just about how long it takes.
The Number That Goes Down When You Get Worse
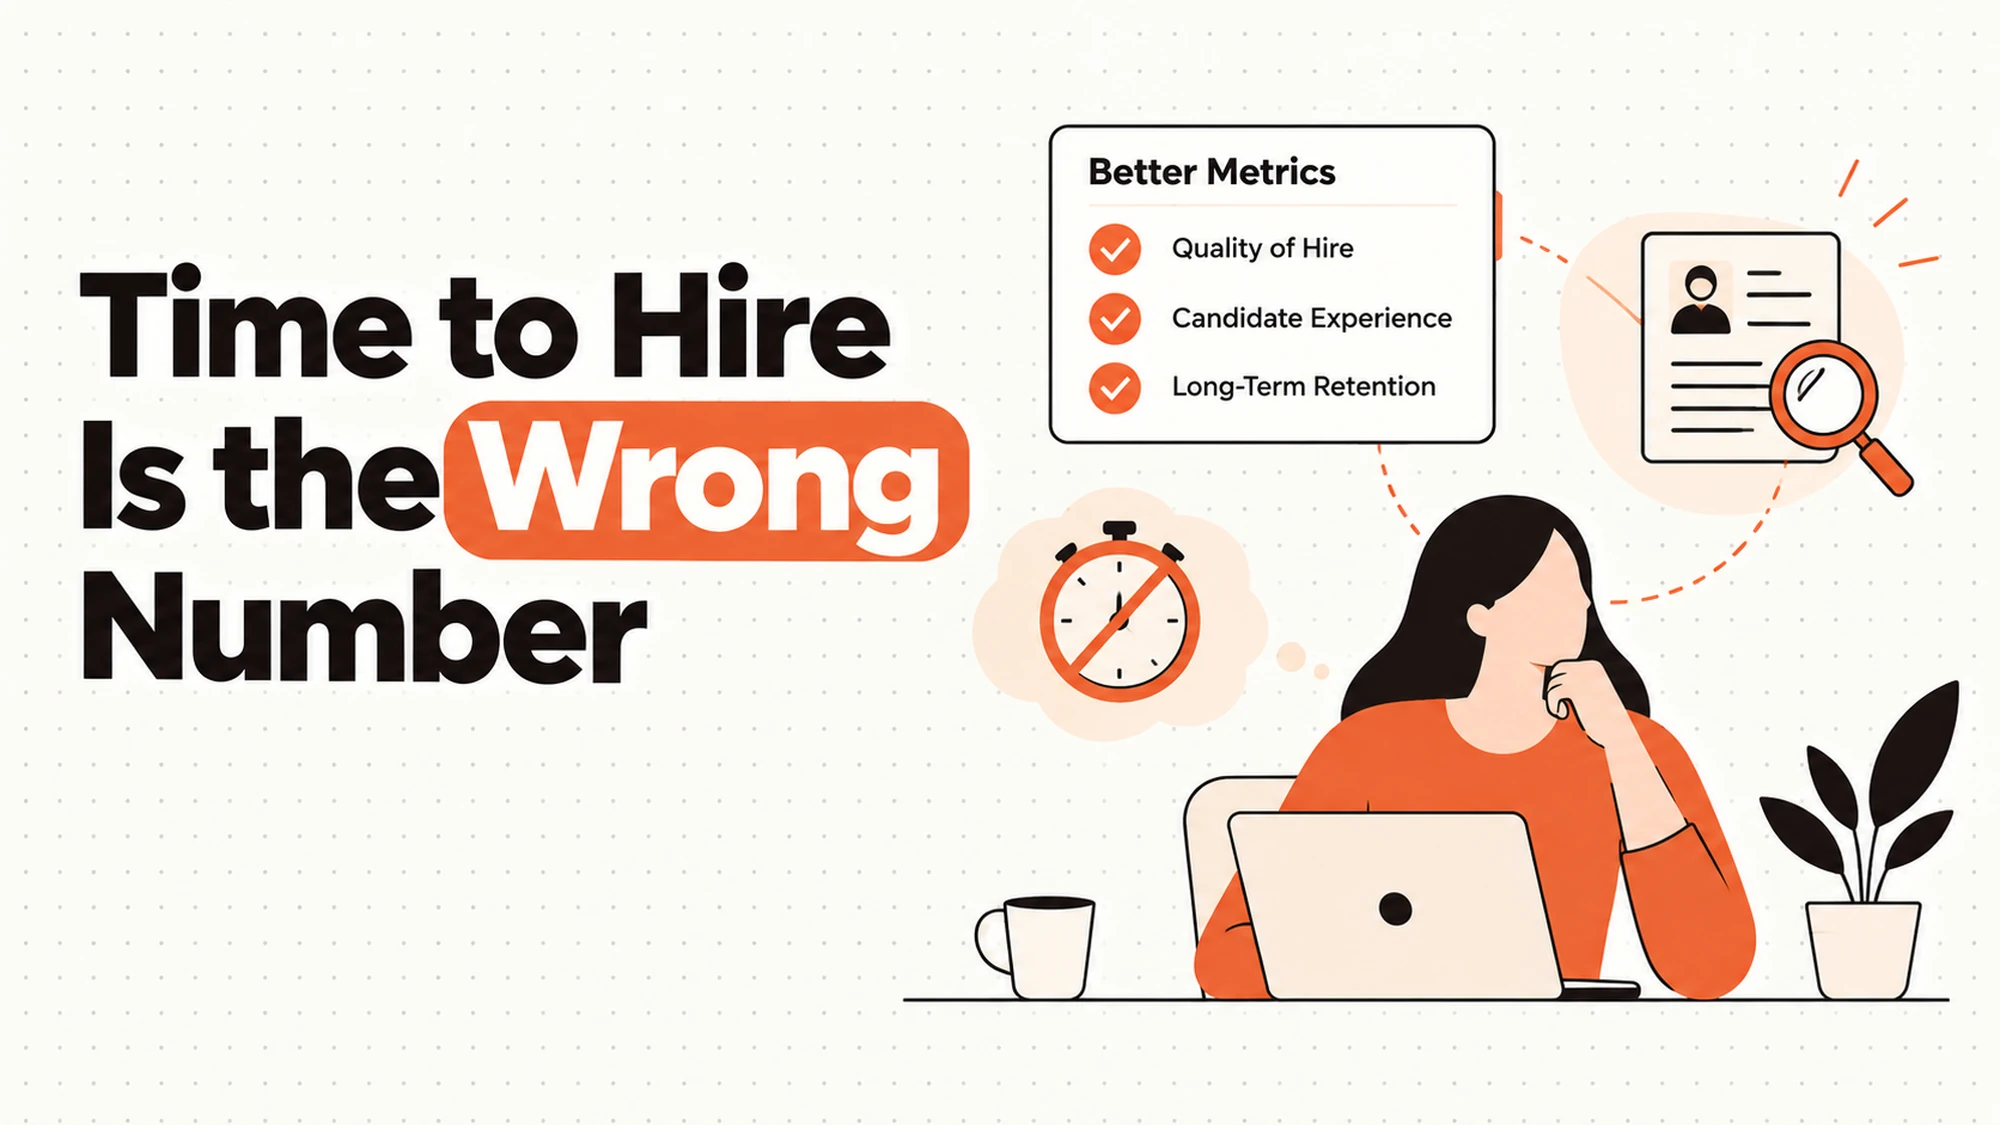
A talent lead reports time to hire every month. It's the first line of the deck, it's the number the leadership team recognises, and it has been quoted back to her twice this quarter as though it were a verdict on the function. She knows something about it that she hasn't found a way to say in the meeting: the fastest way to improve it is to lower the bar. Accept the adequate candidate in week three rather than holding out for the strong one in week six, and the number improves immediately.
This isn't a criticism of anyone in that room. Time to hire survives because it's easy to compute, easy to compare, and easy to understand, and those are genuinely valuable properties in a number that has to travel to people who don't hire. It's on the report because somebody sensible put it there. The trouble is that it's also the number most directly improved by doing the job worse, and nothing about how it's presented makes that visible.
The real issue isn't that time to hire is a bad metric. It's that almost nothing on a standard recruiting dashboard is attached to a decision anybody is about to make, so the dashboard gets built, admired once, and then ignored while the actual decisions get made on instinct. A metric earns its place by changing an action. Most of them don't, and the ones that do are rarely the ones being reported.
Best tools for Recruitment & Hiring
When You Genuinely Do Not Need to Act Yet
Your current setup is genuinely fine. You hire occasionally, roles close without drama, and nobody has asked for a hiring report. Building one now would create a monthly obligation to explain numbers that nobody was worried about. If the function isn't under question and roles aren't stalling, the effort belongs somewhere else.
Friction is starting to show. Somebody has asked why a role took so long, and you answered from memory. That's the first sign you'll need a record, though not yet a dashboard. The cheapest useful step here is recording the dates a role opened and closed, and why any gap happened, because the question will be asked again and the answer improves enormously with even a short history behind it.
It has become a real cost. Hiring numbers are now being reported upward and interpreted by people who don't hire. This is where the wrong metric starts doing damage, because a number that travels without context acquires meaning it doesn't have. A single speed figure quoted in a leadership meeting will shape behaviour whether or not anyone intended it to, and the behaviour it shapes is usually to move faster on weaker candidates.
The edge case that forces it. Somebody proposes a target. A time-to-hire goal, an acceptance rate goal, a cost target. This is the moment where an unexamined metric becomes an incentive, and incentives on hiring numbers have a reliable failure mode: the number improves and the hiring doesn't. If a target is being discussed, the conversation about what the metric actually measures can't be deferred any longer.
There's a second version of this edge case that arrives without warning. A hiring freeze ends, several roles open at once, and suddenly the function is visible in a way it wasn't when it was closing one role a month. Numbers that nobody looked at become the basis of a weekly conversation, and whatever was on the report at that moment becomes the definition of how hiring is going. It's worth deciding what you'd want on that report before the moment arrives, because the metric you're judged on is usually whichever one happened to be available when somebody first asked.
Five Questions This Reader Asks at 11pm
If this number moved, what would I do differently? Ask it of every line on your report. If the honest answer is that you'd note it and carry on, the line is decoration. This is the single test that removes most of a standard dashboard, and removing them is what makes the remainder legible. A short report gets read.
Am I reporting effort or progress? Interviews conducted, candidates screened, roles worked: these are counts of activity, and activity rises when things go badly as reliably as when they go well. A quarter with more interviews per hire is a worse quarter, not a busier one, but the number presents identically. If most of your report is counts, you're describing how hard the team is working rather than what it achieved.
Who reads this, and what do they think it means? A number that leaves your function gets interpreted by somebody without your context. Time to hire reads to an executive as efficiency. Cost per hire reads as thrift. Neither reading is what you meant, and once the misreading is established you'll be managed against it. Decide what each number will be taken to mean before you publish it, not afterwards.
What's the smallest number of roles this is averaged over? Hiring data is thin. An average across a handful of roles moves violently for reasons that have nothing to do with the function, and a single senior search can dominate a quarter. If you report a mean without saying how many roles are behind it, you're inviting confident conclusions from noise.
What would this number look like if we got worse on purpose? Run the thought experiment for each metric. Time to hire improves if you drop standards. Cost per hire improves if you stop using the channel that works. Acceptance improves if you only make safe offers. Any metric that improves under deliberate degradation needs a second number beside it, or it shouldn't be reported alone.
Three Honest Categories the Approaches Split Into
Speed metrics, which measure elapsed time. Time to hire, time to fill, time in each stage. They're right when you have a specific bottleneck to find, because stage-level timing shows you where a process actually stalls, and that's usually somewhere nobody expected. They're the most legible numbers you have and the easiest to explain upward. They fail as a headline measure because they're improved by lowering standards, and because most of the delay in a slow role sits outside the recruiting function entirely, in scheduling, approvals and hiring manager availability. A speed number reported without a quality number beside it is an instruction to move faster on worse candidates.
Conversion metrics, which measure what proportion of people move between stages. Pipeline conversion, offer acceptance, screen-to-interview progression. They're right for diagnosing where a process leaks, and they're the only family that tells you whether a problem is at the top of the funnel or the bottom. A role that attracts nobody and a role that attracts people who then withdraw need completely different fixes, and only conversion distinguishes them. They fail on sample size, badly. Conversion computed over a handful of candidates is noise wearing a decimal point, and it fails again when the stages themselves aren't defined consistently between recruiters.
Outcome metrics, which measure what happened after the hire. Retention of new hires, performance after some months, manager satisfaction, whether the person is still in the role. They're right because they're the only family measuring the thing you actually wanted, and a hiring function judged on outcomes behaves differently from one judged on speed. They fail on lag, which is severe: the outcome of this quarter's hiring isn't visible for a long time, so it can't guide this quarter's decisions. They also fail on attribution, since whether a hire works out depends heavily on the manager, the team and the onboarding, none of which recruiting controls.
Five Diagnostic Questions You Can Self-Assess Against
Which number on your report has changed a decision this year? Go through the last several reports and find a decision that followed from a number. If you can find one, that metric has earned its place permanently. If you can't find any, the report isn't a management tool, it's a ritual, and the honest response is to cut it to the two or three lines somebody would miss.
Are your stage definitions the same across recruiters? Ask two recruiters when a candidate moves from screening to interview, and when a role counts as open. If the answers differ, every conversion number you produce is comparing incomparable things. This is the most common quiet failure in hiring data and it's invisible in the output, because inconsistent definitions still produce a clean-looking percentage.
When did the clock start on your last slow role? Find the role that took longest and establish when it actually began. Frequently the recorded start is the day the requisition was approved, and the real start was weeks earlier when the manager first raised it, or weeks later when the brief was finally agreed. Where you start the clock determines whether the delay looks like a recruiting problem or a decision-making problem, and it's usually the latter.
Could you explain your worst number without defensiveness? Take the figure you'd least like to present and try to explain it in two sentences to somebody who doesn't hire. If the explanation requires context the number doesn't carry, then the number is going to be misread every time it travels. That's an argument for changing what you report, not for reporting it with a longer caveat.
What are you not measuring because it's hard? Almost always the answer is quality of hire and the cost your own team pays in interview time. Both matter more than most of what's on the report, and both are absent because they're inconvenient rather than because they're unimportant. Naming the gap is the first step, because an unmeasured cost is a cost that grows.
Where does your data actually come from? Follow one number back to its source. Somebody typed a date into a field, or a system stamped one automatically when a status changed, and whichever it was determines how much the number can bear. Manually entered dates drift, because people update records when they have time rather than when the event happened. Automatic stamps are consistent but often mark the wrong moment, recording when a recruiter moved a card rather than when the candidate was actually contacted. Neither is wrong exactly, but a number built on either will carry a systematic bias that nothing downstream can correct, and knowing which bias you have is the difference between reading a trend and inventing one.
Six Recruiting Metrics, Reviewed
Time to hire and time to fill
These are two different numbers that get used interchangeably, which is the first problem with them. Time to hire measures from a candidate entering your process to their acceptance, so it describes how well you handle people once you have them. Time to fill measures from a role being approved to somebody accepting, so it includes the sourcing period and the approval delays. They earn their place because they're the clearest way to find a bottleneck when stages are timed separately, and because they're legible to anyone.
Where they genuinely fall short is as summary judgements. Both improve when you accept a weaker candidate sooner, which means reporting either alone creates pressure in exactly the wrong direction. Both are also dominated by things recruiting doesn't control: how quickly a hiring manager gives feedback, how long approval takes, whether interviewers have calendar space. Report them at stage level to diagnose, and never as a single headline figure to be judged on.
Source of hire
Which channel produced the people who actually started. It earns its place because it's the only number that tells you where to spend, and because almost every alternative measure of a channel counts applications, which is a measure of volume rather than value. Recorded properly it lets you retire channels that produce noise and defend the ones that quietly work.
It falls short on attribution, which is genuinely hard rather than merely neglected. Candidates touch several routes: they see a post, hear from a colleague, then apply through a board. Systems record the last click, which is usually the least informative moment. The fix isn't a better report but a question asked at offer, in the candidate's own words, recorded separately from whatever the system captured. Two records, kept apart, tell you where hires come from and where screening load comes from, and those are different problems.
Offer acceptance
Whether the people you choose say yes. It earns its place as an early warning that something outside your control is wrong: pay positioning, the reputation of the team, how the process felt, or a competing market. It's also one of the few numbers where a change genuinely prompts action, because a run of declines forces a conversation about pay or process that would otherwise keep being deferred.
Its limitation is that it's improved by caution. A team that only extends offers it's certain of will show excellent acceptance and may be moving too slowly and too safely to hire well. It's also extremely thin data: most organisations make few enough offers that a single decline moves the figure noticeably, which makes trend reading unreliable. Treat it as a prompt to investigate rather than as a performance measure, and look at the reasons rather than the rate.
Pipeline conversion by stage
How many candidates move from each stage to the next. It earns its place as the best diagnostic tool available, because it localises a problem. A role with few applicants and a role where everyone drops out after the technical stage look identical from outside and need opposite responses. Conversion is what tells them apart, and it does so early enough to act.
It falls short on definitions and on volume. Stages have to mean the same thing to every recruiter or the numbers aren't comparable, and in most organisations they quietly don't. Volume is the harder constraint: conversion computed over a small number of candidates is noise, and it will show dramatic swings that invite explanation when nothing has changed. Use it to compare a role against its own history rather than against another role, and be sceptical of any month with few candidates behind it.
Quality of hire, measured after the fact
Whether the people you hired turned out well, assessed some months in. It earns its place by being the only metric aimed at the actual objective. Everything else on this list is a proxy, and a function measured on proxies optimises proxies. Even a crude version, a manager answering a consistent question at a fixed interval, changes the conversation because it puts the outcome back in view.
The limitations are real and unavoidable. It lags, so it can't steer current decisions. It's confounded by onboarding, management and team conditions that recruiting doesn't control, so a poor result may indict something else entirely. And it depends on manager judgement, which varies. None of that makes it worthless. It makes it a slow-moving check on whether the fast-moving numbers are pointing the right way, which is exactly what a dashboard of proxies needs.
Interviewer load and calendar cost
How much of your organisation's time hiring consumes. It earns its place because it's the largest hidden cost in recruiting and almost nobody counts it. Every interview is time taken from people doing other work, and a process with many stages and large panels can consume a substantial part of a team's week without appearing in any hiring budget. Making it visible is often what finally justifies shortening a loop.
It falls short because it's awkward to collect and unwelcome when presented. It also has a perverse reading: a manager may see a low number as evidence that hiring is cheap rather than that the process is lean. Pair it with time to fill, because the two together tell the real story. A short process that consumes enormous internal time is not efficient, it's just fast at spending somebody else's budget.
The Decision Table
| Situation | Scale | Setup | Primary Pain | Recommended Starting Point |
|---|---|---|---|---|
| Nobody asks for hiring numbers | Under fifty | One site | None | Record open and close dates, nothing more |
| One role is unaccountably slow | Any | Any | Cannot locate the delay | Stage-level timing on that role only |
| Roles attract nobody suitable | Any | Any | Top of funnel is empty | Source of hire, recorded at offer |
| Candidates drop out late | Any | Any | Effort wasted at the end | Pipeline conversion by stage |
| Offers keep being declined | Any | Any | Losing at the last step | Acceptance reasons, not the rate |
| Executives judge the function on speed | Two hundred plus | Any | A single number is being misread | Time to fill paired with a quality measure |
| Interviewers are complaining | Any | Any | Hidden internal cost | Interviewer load beside time to fill |
Most functions sit in two of these rows at once and respond by reporting everything. Resist that. Pick the row describing your worst current problem, add the one metric that diagnoses it, and remove a line from the report to make room.
The Metric That Reports Effort as Progress
There's a family of numbers that look like performance and measure workload: interviews conducted, candidates screened, roles worked, submissions made. They're the easiest numbers to produce and the most misleading to publish, because every one of them rises when hiring is going badly. More interviews per hire means worse shortlists. More candidates screened per offer means worse sourcing. Presented as counts, both read as productivity.
Counting interviews is the clearest example. A quarter where the team conducted many more interviews is a quarter where something upstream failed, and the number will be presented as evidence of a busy, committed function. It might be. It's equally consistent with adverts that attract the wrong people, a brief nobody agreed, or a hiring manager who can't decide. The count can't distinguish between them, and its natural reading is the flattering one.
The fix is to express effort as a ratio against an outcome rather than as a total. Interviews per hire rather than interviews conducted. Candidates screened per offer rather than candidates screened. The ratio moves in the honest direction: it gets worse when the process gets worse, which is what you want from a number you'll be judged on. It's also harder to game, because improving it requires actually improving the funnel rather than working longer.
Be careful about one thing. Ratios of that kind become unstable when the denominator is small, and hiring denominators usually are. A single hire in a quarter makes interviews per hire meaningless. Report the ratio with the count of hires beside it, and resist reading a trend into a handful of roles.
Reporting Hiring to People Who Do Not Hire
An executive asking about hiring is rarely asking the question they've said. They ask how long roles take, and what they want to know is whether the plan will land. They ask what hiring costs, and what they want to know is whether the spend is under control. Answering the literal question with a precise number is how a function ends up managed against a measure nobody chose deliberately.
| What they think they are asking | What they actually need | What to show instead |
|---|---|---|
| How long does hiring take? | Will the plan land this quarter? | Roles open against plan, with expected close dates |
| Why is this role still open? | Is somebody on it, and is it stuck? | Where the role is stalled, and who owns the next step |
| What does hiring cost us? | Is the spend proportionate and controlled? | Spend by channel beside hires by channel |
| Are we hiring good people? | Are last year's hires working out? | A quality measure taken at a fixed interval |
| Why is recruiting so slow? | Is the delay ours or theirs? | Time split between recruiting stages and manager stages |
| Can we hire faster? | What would it cost to go faster? | The trade named explicitly, speed against selectivity |
The last row is the one worth preparing for, because it's the question that eventually arrives. The honest answer is that you can hire faster, and the cost is selectivity. Saying that plainly, before a target gets set, is what stops a speed goal being imposed as though it were free. A function that has named the trade in advance is in a much stronger position than one explaining it afterwards.
Split the timeline between what recruiting controls and what it doesn't. Most delay in a slow role sits in feedback, scheduling and approval, and a single elapsed figure hides that entirely. Showing the split isn't deflection. It's the only way the conversation reaches the actual bottleneck, which is usually a manager's calendar rather than a recruiter's effort.
What to Put in Writing
Metrics decisions get made once and inherited forever. The next person receives a report with no record of why each line is on it, so nothing is ever removed and the report only grows.
| Artefact | Who owns it | When it is written | What it prevents |
|---|---|---|---|
| Why each metric is on the report | Talent lead | When the metric is added | A report nobody can prune |
| Stage definitions, in plain words | Talent lead | Before any conversion is reported | Comparing incomparable numbers |
| Where the clock starts and stops | Talent lead | Before any speed metric is reported | Arguments about whether a role was slow |
| The decision each metric supports | Talent lead | When the metric is added | Reporting trivia indefinitely |
| What a target would cost | Talent lead | Before a target is agreed | A speed goal imposed as though free |
| Quality measure and its interval | Talent lead and hiring manager | When outcomes are first reviewed | Judging hiring on proxies alone |
The third row prevents more arguments than the rest combined. Whether a role took a long time depends almost entirely on when you started counting, and in the absence of a written rule everybody counts from the moment that suits their account of events.
Questions to Ask Before You Commit
On purpose. What decision does this number support, and who makes it? A bad answer names an audience rather than a decision.
On direction. What would make this number improve while hiring got worse? Every metric here has such a path. A bad answer is that it couldn't happen.
On definitions. Would two recruiters produce the same figure from the same data? If they wouldn't, the number isn't ready to leave the function. A bad answer is that it's obvious what the stages mean.
On sample size. How many roles or candidates is this averaged over, and is that enough to read a trend? A bad answer reports a mean without the count beside it.
On targets. If this became a goal, what would people do differently to hit it? Ask before the target is set. A bad answer assumes everyone would simply work harder.
On removal. What would we take off the report to add this? A report that only grows is a report that stops being read. A bad answer is that there's room for one more.
What Getting This Wrong Costs
The first cost is behavioural and it arrives quietly. A number that gets reported becomes a number people manage toward, whether or not anyone framed it as a target. Report speed alone for a few quarters and decisions will shift toward the available candidate over the strong one, not because anyone decided to lower the bar but because the visible measure rewards it. Nobody notices, because the metric improves.
The second cost is that a dashboard of proxies displaces the harder question. Time, cost and conversion are all easier to produce than any measure of whether the hires were good, so they crowd it out. A function that reports six proxies and no outcome will eventually be optimised entirely on proxies, and the gap between the two only becomes visible in retention figures a year later, by which time the cause is hard to argue.
The third is credibility, and it's the one that bites hardest. A number published without its context gets misread, the misreading gets repeated, and the correction never catches up. Once an executive team believes hiring is slow, every subsequent number is interpreted through that belief. Choosing what to publish is therefore not an administrative decision. It's the decision that sets what the function will be held to for years.
So before you add a line to the report: are you trying to diagnose something, defend something, or decide something? Diagnosis needs stage-level detail and a small audience. Defence needs context and a paired measure. Decision needs one number and a named owner. Most reports try to do all three at once and manage none of them.
When You Are Ready to Go Further
The work above needs no tooling. It needs somebody willing to delete lines from a report and to name, out loud, the trade between speed and selectivity before a target is set.
The next step, for a reader who wants to know whether their process is unusually slow or their loop unusually heavy compared with organisations of similar shape, is comparison work. That's the part you can't do from inside your own numbers, because you only ever see your own.
HROpsLab publishes independent comparison work across HR tooling, applicant tracking and payroll. We sell nothing, we take no vendor money, and we publish no paid placements. If the next step is testing your assumptions against the wider market, our comparison work is one place to start.
Frequently Asked Questions
Which recruiting metrics actually matter?
The ones attached to a decision somebody is about to make. That's a shorter list than any standard dashboard and it differs by organisation, because it depends on which part of your process is currently failing. If shortlists are weak, source of hire matters most. If candidates withdraw late, conversion by stage does. If nobody can say whether last year's hires worked out, an outcome measure matters more than anything about speed. The test to apply to every line is whether a plausible movement in it would change what somebody does next week.
What is a good time to hire?
There isn't a general answer, and be sceptical of anyone who offers one. The figure depends on the role, the seniority, the market and how your approval process works, and a number imported from elsewhere will describe a different organisation hiring different people. The useful comparison is against your own trailing history for comparable roles, which at least holds those variables roughly constant. More importantly, judge speed alongside something that captures quality, because time to hire improves when you accept weaker candidates sooner and nothing in the number itself will tell you that's what happened.
What is the difference between time to hire and time to fill?
Time to hire measures from a candidate entering your process to their acceptance, so it describes how well you handle people once you have them. Time to fill measures from the role being approved to somebody accepting, so it includes sourcing and any approval delay. Time to fill is the more honest business number because it covers the whole period the work went undone, but it's heavily affected by things recruiting doesn't control. Reporting both, clearly labelled, prevents the common confusion where one is quoted and the other is assumed.
How do you measure quality of hire?
Crudely, consistently, and at a fixed interval. The practical version is a short set of identical questions put to the hiring manager some months after the person starts, asked the same way every time, with the answers recorded. It won't be precise, and precision isn't the point. The point is having any outcome measure at all to check your proxies against, because a function measured only on speed and cost will optimise speed and cost. Be careful attributing the result solely to hiring, since onboarding and management shape it heavily.
Should I benchmark against other companies?
Treat external benchmarks with real caution. Published figures rarely define their terms the way you do, rarely describe organisations shaped like yours, and travel a long way from wherever they were computed. Your own trailing data for comparable roles is a much sounder reference, because the definitions are consistent and the context is yours. If you do use an outside figure, establish where the clock started and what counted as a hire before you compare anything, and expect those definitions to differ enough to make the comparison shaky.
How many metrics should a hiring dashboard have?
Few enough that somebody reads all of them. In practice that means a small handful: one about speed, one about origin, one about conversion, and one about outcomes, with the rest available if asked rather than published by default. The constraint isn't screen space, it's attention. A long report gets skimmed, and skimming means the loudest number wins regardless of which one matters. Every line you add makes the remaining lines less likely to be read, so adding one should mean removing one.
How do I attribute a hire who came through several channels?
Keep two records rather than forcing one answer. Ask the candidate at offer how they first heard about the role, in their own words, and record that as the origin. Separately keep whatever the system captured about which route the application arrived through. The first tells you which channel produces hires, the second tells you where your screening load comes from, and they're frequently different channels. Collapsing them into a single source field destroys the more useful of the two, because systems record the last click by default.
What should I report to the executive team?
Report against the plan rather than about the process. What roles are open, whether they'll close in time for the work that depends on them, where anything is stuck and who owns the next step. That answers the question actually being asked, which is whether the plan will land. Add one measure of whether recent hires are working out, because otherwise the conversation is entirely about speed. And name the trade between speed and selectivity before anyone proposes a target, since it's far harder to introduce that point afterwards.
Report the numbers that change a decision, and delete the rest.